I love the work of Edward Tufte, a data design guru who writes beautiful books that also serve to illustrate his ideas about design.
I was first introduced to Tufte’s books shortly after I graduated from college, and immediately asked for one for Christmas (they’re not cheap). I find that his ideas challenge me to pay attention to design in everything I do, and help me think about how and why design matters.
That’s why I was excited to see that a new feature in Libronix DLS version 3.0 (the first beta release was recently posted, and all I can say is WOW!) is rooted in one of Tufte’s ideas for conveying a lot of information in a compact, unobtrusive form.
In the second-generation Exegetical Guide, there is a small graph next to each word from the passage. It’s called a “Lemma Density Graph” and it’s an example of what’s known as a sparkline.
Sparkline is a term coined by Edward Tufte to describe “small, high-resolution graphics embedded in a context of words, numbers, images. Sparklines are data-intense, design-simple, word-sized graphics.” You can read all about sparklines in this draft chapter from Tufte’s new book, along with a lengthy series of posts on how sparklines are being used in various contexts.
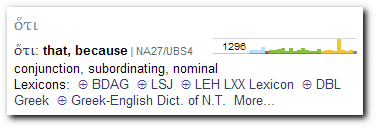
In the example below, taken from the new Exegetical Guide, the Lemma Density Graph sparkline indicates the density of the lemma ὅτι across the New Testament. The more a particular biblical book uses ὅτι, the taller the bar is for that book. Of course, the height is proportional to the total number of words in each book so that the graph is not skewed toward long books like the Gospels.
As you can see, the word occurs 1296 times in the New Testament. Each category of Bible book (Gospels, Acts, Pauline epistles, other epistles, Revelation) gets its own color and you can see that a yellow bar near the end is the big winner.
So which book is it dominating the graph here? By hovering the mouse over the bar in the chart, I can see that it’s 1 John and the word is used 76 times.
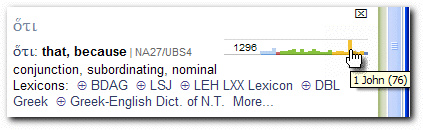
This is not a surprise to anyone who has studied 1 John and noted the tight, logical progression employed by the author. The sparkline provides a great visual illustration of this rhetorical characteristic, and it’s viewable at a glance, inline with the rest of the information.
I can even interact with the graph in ways that take me a step deeper in my study of ὅτι…If I click the 1 John bar, Graph Bible Search Results opens and I can choose any number of graphs to tease meaning from the data (e.g., Number of Hits in Chapter / Number of Words in Chapter) or export it to Excel and work with it there.
These sparklines can draw out all manner of word usage patterns such as hapax legomena, words peculiar to a single book or author, or words that appear more often in certain genres.
I think it’s a very nifty little feature, one that I trust our users will find to be a helpful addition to version 3.0. I also think it’s very cool that this feature is rooted in solid design principles from one of the leading minds on the subject. One of the things I appreciate about our application is that the developers pay attention to “small details” of design so that it not only functions well but looks great, too.
(Note: If you get excited by this post and decide to install the beta, please note that our beta releases are unsupported and be sure to read the warnings first.)